Learn and Integrate
Through independent learning and collaborative study, attain, use, and develop knowledge in the arts, humanities, sciences, and social sciences, with disciplinary specialization and the ability to integrate information across disciplines.
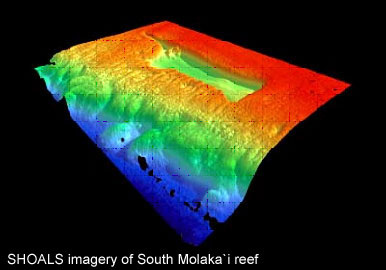
Text Source: http://wiki.gis.com/wiki/index.php/LIDAR
Image source: http://water.usgs.gov/osw/gps/GPS_projects.html |
Making Sense of Complex Influences
During my summer GIS class, I discovered the tremendous power that visualizing data in great detail has to offer. I now believe that it can effectively be used in research to help control or even eliminate an invasive species. I am excited about the insight GIS might provide to my area of research. At some point, I may even return to school to get a certificate in GIS.
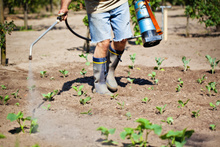
Recent advancements in radar and LIDAR technology are being used now to penetrate the vertical profile of a forest canopy and quantify its structure. LIDAR is used in many applications in forestry and farming to create a topographical map of the fields and reveal the slopes and sun exposure of the land. This technology can indicate which areas have the heaviest infestations. It is being used to help determine where to apply costly herbicides and insecticides. Why not use it to help in the study of how invasive species spread by analyzing annual population migration patterns? After working in the field to contain and eradicate invasive species manually on foot spraying herbicides and/or insecticides, I have decided that the only way to get the upper hand over some of the most successful invasive species in the northwest is to scale up our control efforts. We need to use all the research techniques available to us because we are loosing the battle on several fronts. One way to scaleup is to use GIS mapping to allow us to study population pattern shifts over a very large regions. Nature is too complex to glean all information needed from a small control research plot. Important factors such as rainfall, terrain, soil quality, air temperature, water sources, and competing species all play a part and must factored into any effective research study. |
|
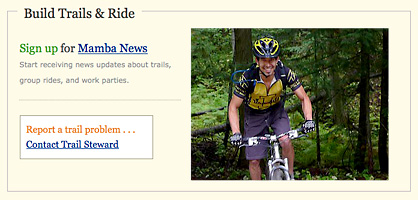
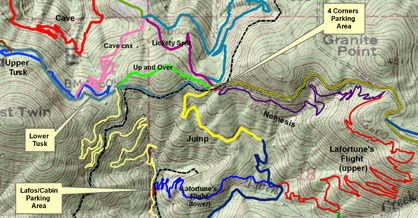
Mapping Mountain Bike Trails using GISI am currently working with the local Mountain Bike club, MAMBA, to create a detailed map of the bike trails overlaid on a topo map. MAMBA (Moscow Area Mountain Bike Association) works to build and maintain sustainable trails on Moscow Mountain. The mountain is virtually all private property and its land owners generously let the community recreate on their property.
I got introduced to MAMBA on my first visit to local bike shop. I soon discovered the vast network of trails maintained by the club and spent many a free hour exploring the mountain. When I learned of the club's needed for accurate and detailed maps of their trails, I realized that I could volunteer my time using my GIS skills. My initial topo map work was completed as part of my Summer 2012 GIS course in CNR. I used a digital elevation model with the correct manipulation to create a shaded or 3-D effect on the hillsides. I created an overall map to depict a broad scale of 1:24,000 scale for quick reference with trail mileages, and then I made four maps at a finer scale 1:12,000 for increased detail. All mileages were computed in ArcMap GIS. My initial efforts mapped 20 of the Moscow Mountain trails maintained by the club. Since then, I have continued adding additional trails to the maps with a goal of completing all 50 MAMBA trails. |